Data Analyst Program — 8 Weeks
Only 60 slots available — enroll early to secure your spot.
Program Overview
Live + Recorded Sessions
Monday to Friday
+ Task Submission
20 Scholarships
New Batch
incl. LOR for Top 3
Program Structure
Weeks 1–6 — Live Training
Daily 1-hour live sessions Mon–Fri covering Excel, Power BI, SQL, and more.
Every Saturday — Doubt Solving
Live interactive doubt-clearing sessions + weekly task submission and review.
Weeks 7–8 — Real-World Project
Apply all learned skills to build a complete, business-grade analytics project.
Final Week — Evaluation
Project presentation, performance evaluation, and certificate distribution.
Certifications Awarded
Internship Completion Certificate
Awarded on successful completion of the program.
Performance Evaluation Certificate
Based on attendance, tasks, and overall performance.
Appreciation Certificate
Recognizing your effort and dedication throughout.
Letter of Recommendation
For Top 3 Performers — based on attendance, performance & project quality.
Complete Syllabus
A structured, progressive curriculum covering 4 major tools over 6 weeks of live training.
Total hours: Excel (7–9 hrs) · Power BI (10–12 hrs) · SQL (8–10 hrs) · End-to-End Project (8–10 hrs)
| Chapter | Topic | Day |
|---|---|---|
| Ch. 1 | Introduction & Basic Excel | Day 1 |
| Ch. 2 | Data Entry and Basic Formulas | Day 2 |
| Ch. 3 | Data Cleaning and Preparation | Day 3 |
| Ch. 4 | Logical Functions, Sort, Filters & Tables | Day 4 |
| Ch. 5 | VLOOKUP, MATCH and INDEX | Day 5 |
| Ch. 6 | Statistical Formulas & Date Formulas | Day 6 |
| Ch. 7 | Pivot Tables | Day 7 |
| Ch. 8 | Dashboard Project in Excel | Day 8 |
| Chapter | Topics | Day |
|---|---|---|
| Ch. 1 | Power BI IntroductionImport Data & Data Transformation | Day 1 |
| Ch. 2 | Data Modelling — Create RelationshipsPage Formatting & Adding Visuals — Column Chart | Day 2 |
| Ch. 3 | Formatting of Column and Bar ChartPower Query Transformation | Day 3 |
| Ch. 4 | Area and Line Chart VisualFormatting of Line and Area Chart | Day 4 |
| Ch. 5 | Waterfall and Funnel ChartScatter Chart, Pie Chart, and Donut ChartTree Map and Filled Map Visuals | Day 5 |
| Ch. 6 | Gauge Chart and KPI, Card and Multirow CardNew Card in Power BI | Day 6 |
| Ch. 7 | Slicer in Power BI, New Slicer in Power BINew Slicer with Images in Power BITable and Matrix | Day 7 |
| Ch. 8 | DAX Formula — SUM and SUMXCalculated Columns vs MeasuresDate DAX Formulas | Day 8 |
| Ch. 9 | CALCULATE DAX FormulaDATESBETWEEN DAX FormulaMTD, QTD, YTD DAX Formulas — LinkedIn Example | Day 9 |
| Ch. 10 | Create Interactive Dashboard Part | Day 10 |
| Chapter | Topics | Day |
|---|---|---|
| Ch. 1 | Intro, What is SQL & Types of CommandsCreate Database and Table in SQLInserting Data in Table in SQL | Day 1 |
| Ch. 2 | Deleting Rows and Columns from TableUpdate Data in SQLUpdate Data in SQL using SQL Toolbar | Day 2 |
| Ch. 3 | Query Toolbar in SQLALTER Column and Datatype in SQLAssignment with Solution | Day 3 |
| Ch. 4 | How to Import CSV File into SQLHow to Import CSV File Directly into SQLTypes of Operators in SQL | Day 4 |
| Ch. 5 | Comparison Operators in SQLLogical Operators in SQLBETWEEN, LIKE and IN Operator in SQLOther Operators & Set Operators in SQL | Day 5 |
| Ch. 6 | Functions in SQL — String FunctionsDate & Time Functions in SQL | Day 6 |
| Ch. 7 | Conditional Functions in SQLAssignment on Case Functions in SQLCOALESCE Function in SQL | Day 7 |
| Ch. 8 | How to Use Joins in SQL — All Types with Examples | Day 8 |
| Ch. 9 | End-to-End Project Part | Day 9 |
Sample Certificates
Here's a preview of the certificates every participant receives upon completion.
Internship Completion Certificate
Awarded to every participant who completes the program.
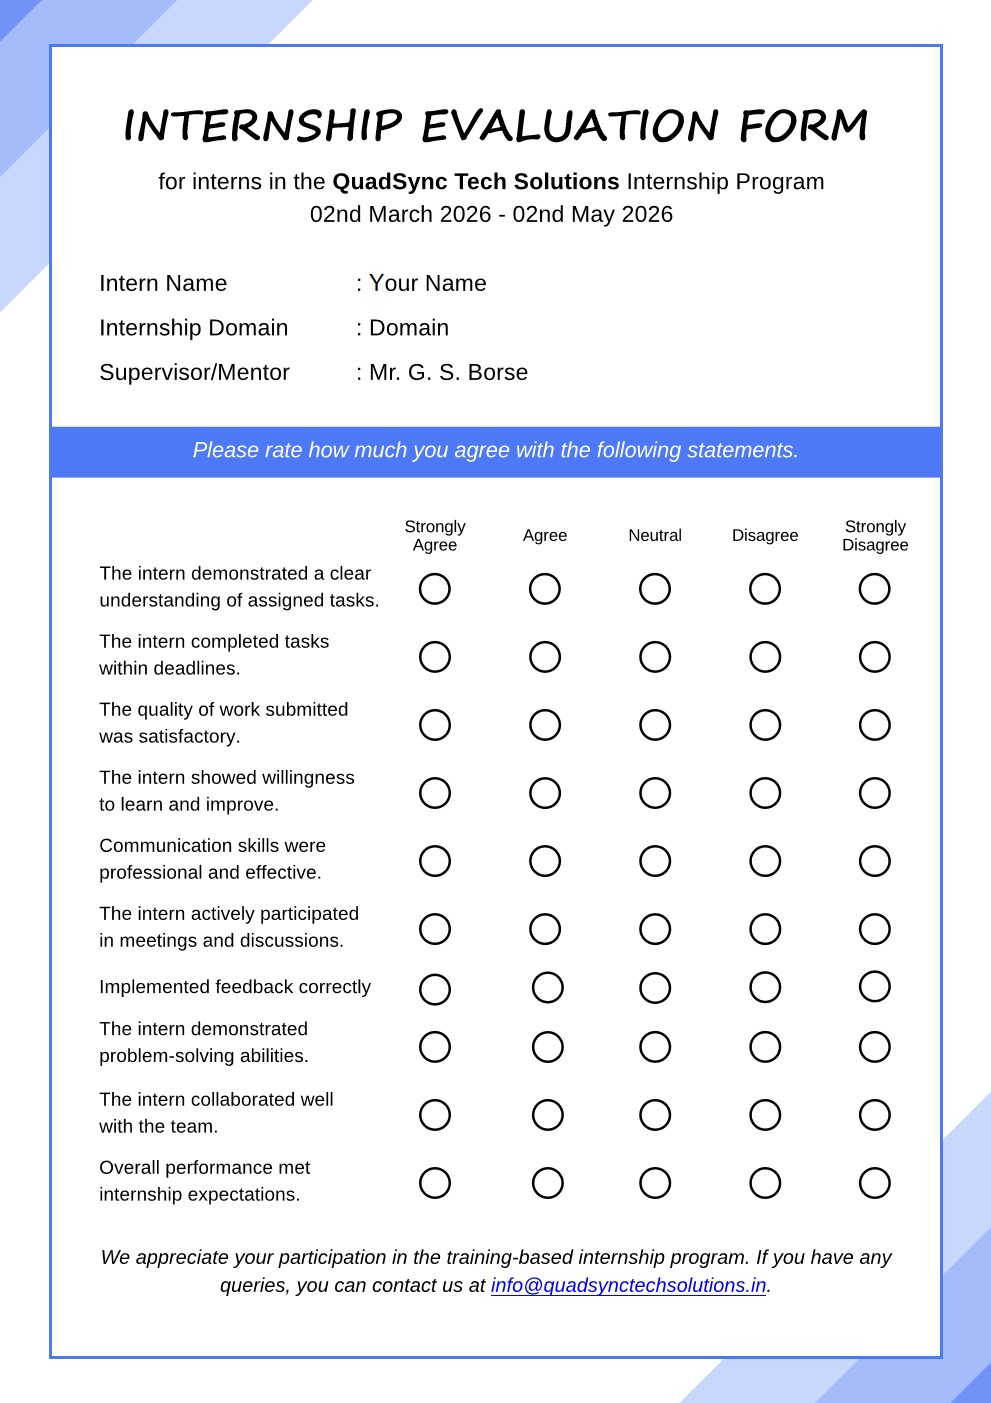
Training Evaluation Certificate
Based on attendance, tasks submitted, and performance.
Appreciation Certificate
Recognizing your dedication and consistent performance throughout the program.
Letter of Recommendation
Exclusively for Top 3 Performers based on project quality and attendance.
Sample Session Videos
Get a feel for the quality of our live training sessions.
Excel for Data Analysts — Intro Session
Learn data entry, formulas, and formatting using real business data.
Power BI Dashboard — Sample Session
Build interactive dashboards using Power Query and DAX.
SQL Fundamentals — Sample Session
Introduction to SQL queries, filters, joins, and business use cases.